

Why This Report Matters
Alternative asset management plays an important role in financial markets. It pools capital from sophisticated and institutional investors and allocates it to businesses, infrastructure and other real-economy investments that may be less well served by public markets or traditional bank finance. It also supports the functioning of markets through activities such as liquidity provision, risk transfer and investment intermediation. The sector spans a diverse range of strategies (private equity, hedge funds, real estate, private credit and fund of funds) which the FCA groups as "fund types".
On 3 September 2026, the FCA published *The UK alternative investment fund market: Evidence from regulatory reporting*. It is the first attempt to build a market-wide picture of the sector using AIFMD regulatory returns rather than commercial datasets or survey estimates. For firms operating in this market, including managers, AIFM hosting platforms, depositaries, administrators, distributors and advisers, it is now the reference dataset the regulator itself is working from, and it directly informs the FCA's proposals to modernise the UK AIFM regime.
Three definitional points shape everything that follows. First, the population is AIFs marketed to UK investors, which includes funds managed overseas, so reported assets and exposures reflect each fund's global investor base and investment activity, not UK investors alone. Second, overseas-managed ETFs that report under AIFMD are excluded: predominantly US-managed, they accounted for £2.9tn of NAV at year-end 2025 despite being only 2% of funds, and they do not pursue alternative strategies. Third, fund types are self-reported by managers, with the FCA applying adjustments, notably to separate private credit funds previously buried in the residual "other" category.
The Market: £5.1tn and Growing
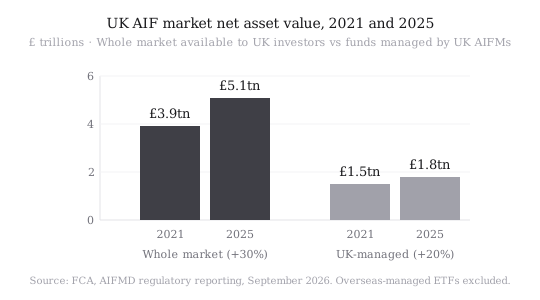
The set of AIFs available to UK investors has expanded steadily over the last five years. Total net asset value (NAV) increased by 30% to £5.1tn in 2025. Over the same period, NAV managed by UK AIFMs rose from £1.5tn to £1.8tn.
Growth was broad-based. Every fund type increased total NAV between 2021 and 2025 except real estate, which contracted modestly by 2%. Private credit grew fastest at 127%, followed by private equity at 53%. Despite that, the residual "other" category remained the largest fund type by NAV, at around 3,000 funds accounting for 25% of reported NAV, dominated by funds pursuing equity and fixed-income strategies rather than classic private-market exposures.
The private credit story is one of count as much as size: the number of private credit funds has more than doubled since 2021 and the segment has continued to attract positive investor inflows. It nonetheless remains relatively small when set against hedge funds and private equity.
A Domestic Sector in an International Market
The market is highly international. The UK remains an important domicile and management location, but many of the largest funds available to UK investors are domiciled overseas, particularly in Luxembourg, the Cayman Islands and the United States. Asset allocations are similarly global, with North America and continental Europe the largest destinations for investment capital.
UK-based AIFMs manage 43% of AIFs and 35% of total NAV in funds marketed to UK investors. The gap between fund count and NAV share is where the structural story sits: in private equity and real estate the UK accounts for a relatively large share of fund numbers (58% and 53% respectively) but a much smaller share of aggregate NAV (22% and 15%). Many UK-managed funds, in other words, are small.
UK-managed private equity, private credit and real estate funds also show a stronger domestic investment focus, which the FCA suggests may reflect the value of local knowledge and expertise in those markets.
Alongside the large international groups sit specialist sectors tied to UK financial-sector strengths. Insurance-linked funds channel institutional capital into insurance and reinsurance risk: just over 100 funds in the FCA's sample since 2021, around half managed from the UK, with aggregate NAV between £22.5bn and £26.2bn and domiciles concentrated in Bermuda and the Cayman Islands.
2,174 AIFMs, and How They Are Classified
There are 2,174 AIFMs managing AIFs marketed to UK investors. Under the current regime, UK AIFMs are classified by size and use of leverage, with full-scope firms subject to the most stringent requirements. AIFs neither domiciled nor managed in the UK can be marketed to UK investors under the National Private Placement Regime (NPPR).
| Category | Managers | Funds | NAV (£bn) | Share of NAV |
|---|---|---|---|---|
| Full-scope UK AIFM | 549 | 3,615 | 1,778.5 | 22.2% |
| Small authorised UK AIFM | 301 | 1,408 | 25.8 | 0.3% |
| Small registered UK AIFM | 63 | 128 | 5.4 | 0.1% |
| NPPR AIFM | 1,618 | 6,558 | 6,206.3 | 77.4% |
To look at the management sector rather than the legal entity, the FCA groups AIFMs by parent entity using company-structure data. That exercise identifies 619 AIFMs, 25% of the population but 57% of NAV, belonging to 160 parent groups.
It is worth being explicit about scope. The AIF management sector includes participants well beyond AIFMs: delegated investment managers, depositaries, custodians, prime brokers, fund administrators and independent valuation firms. The FCA's analysis covers only the AIFM activities that AIFMD reporting captures, so delegated portfolio management by MiFID investment firms sits outside the numbers.
Specialists Alongside a Few Very Large Firms
Most managers specialise. More than 80% of firms or groups with an identifiable leading fund type report managing only one fund type, and that share has been stable over time, including among UK managers.
The manager population has grown slightly since 2021, but the composition has shifted. The number of groups with private equity as their primary fund type has risen by almost 30%, consistent with the growth in private equity fund count. The number with hedge funds as their primary type has declined slightly.
Scale has crept up on both dimensions: the average manager now runs over four funds with over £0.5bn of NAV per fund. Growth in average fund size has been more modest among UK managers, which remain significantly smaller than the market average while managing slightly more funds each. By fund type, hedge fund and real estate specialists manage the fewest funds, fewer than three on average, but those funds are among the largest. Fund of funds and private credit managers run wider ranges, averaging over six and over four funds respectively.
Half of Assets Sit With 25 Managers
Across all fund types, the largest 25 managers account for around half of total NAV. Concentration is sharper in specific strategies: among managers whose primary strategy is fund of funds, the top 25 hold 73% of NAV; in private credit, 66%. The largest five firms alone account for 38% of fund of funds NAV and 28% of private credit NAV.
For service providers and distributors, this is the commercially relevant finding. A market with 2,174 registered managers behaves, in asset terms, like a market with a few dozen buyers of scale and a very long tail of specialists with materially different operating budgets and outsourcing needs.
Professional Investors Remain at the Centre
This is the chapter that most often gets misread in commentary about "the retailisation of private markets".
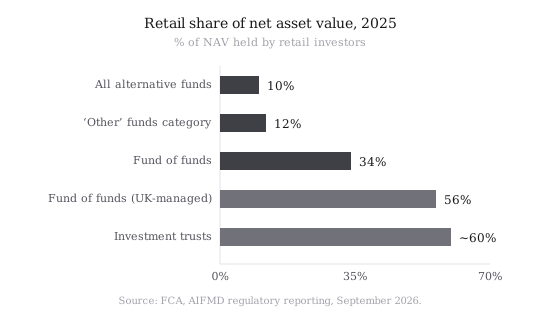
Despite increasing interest in private markets, alternative funds remain overwhelmingly a market for professional investors. Institutions and non-institutional professional investors hold 90% of NAV; retail investors account for just 10%. The composition of the investor base has remained broadly stable over the past five years.
Within UK-managed funds the retail share is higher but still a minority: professionals hold 80% and retail 20%. Retail NAV in UK-managed funds has grown in absolute terms, from £159.4bn in 2016 to £366.9bn in 2025.
Where retail money actually sits is concentrated in two categories. Fund of funds holds 34% retail NAV market-wide, rising to 56% among UK-managed funds. The "other" category holds 12% market-wide and 19% UK-managed. Retail-eligible authorised structures make up a small share of UK-managed AIFs by count: NURS at 18%, QIS at 2%, and LTAFs at 0.4%.
Investment Trusts as the Retail Bridge
The "other" category includes most investment trusts, which are closed-ended public companies admitted to trading on a UK stock exchange. They play a role no open-ended structure currently matches: providing retail investors with access to UK and global businesses and long-term investment opportunities through a structure that supplies patient capital and does not have to sell assets to meet redemptions.
Around 280 investment trusts trade on the London Stock Exchange: 258 on the Main Market, 20 on the Specialist Fund Segment and 2 on AIM, comprising roughly 225 general trusts, 44 VCTs and 11 REITs. Of these, 244 could be matched to AIFMD data, representing about £165.2bn of market capitalisation against £174.9bn of NAV.
Retail investors have consistently held around 60% of investment trust NAV over the past decade. Their private-asset exposure is uneven, however: the average trust reports roughly 20% allocation to private assets, but the median is zero. Around 15% of assets are unlisted equity and 5% structured credit or loans, concentrated in a subset of specialist vehicles.
Leverage and Liquidity: Concentrated, Not Widespread
Because UK-based AIFMs are subject to closer FCA oversight, their leverage and liquidity practices receive particular attention.
On the Adjusted Leverage Ratio (ALR), aggregate leverage excluding hedge funds has remained broadly stable at around 99–114% of NAV between 2016 and 2025, where 100% indicates no leverage. Hedge funds account for a disproportionate share of reported leverage: 2025 median ALRs were 812% for macro, 664% for managed futures and 358% for relative value strategies.
The typical fund reports little or no leverage. Real estate and private credit funds show greater dispersion and a higher concentration of funds with ALRs above 150% than private equity or fund of funds. One caveat matters for interpretation: the ALR captures leverage reported at fund level only. Leverage inside underlying portfolio companies is generally not reflected.
On liquidity, NAV-weighted reported profiles for UK-managed AIFs do not indicate a market-wide shortfall under normal market conditions. Some mismatch appears over shorter horizons, particularly among real estate funds, but those funds represent under 8% of UK-managed funds and 3.5% of NAV.
What This Means for Firms
Four things follow for firms operating in or serving this market.
The regulator now has a baseline. Proposals to modernise the AIFM regime will be argued against this dataset. Positioning papers, consultation responses and product cases that contradict it without addressing it will be weaker for that.
Retail distribution is still a narrow channel. At 10% of whole-market NAV, and with LTAFs at 0.4% of UK-managed AIF count, retail access is early-stage in scale terms even where it is prominent in the trade press. Our companion analysis for individual investors, The UK Fund Market and Retail Capital, looks at the same data from the investor's side.
Concentration shapes the addressable market. Depositaries, administrators, valuation firms and distribution platforms face a bifurcated client base: a top tier with scale-driven procurement, and a long tail where cost per fund dominates the decision.
Specialisation is stable, not transitional. The 80% single-fund-type share has not moved in five years. Multi-strategy expansion is the exception rather than the direction of travel.
Sources
FCA (2026), *The UK alternative investment fund market: Evidence from regulatory reporting*, 3 September 2026. All market figures in this article are drawn from that publication, which is based on AIFMD regulatory returns and excludes overseas-managed ETFs.
Investment Week (2026), "FCA: Top 25 UK AIFMs manage half of client assets as private credit interest surges", 3 September 2026, including comments from Kate Collyer, FCA chief economist.
Supporting references cited within the FCA note include Moody's company-structure data (2026), Aon (2026), Swiss Re (2026) and the London Market Group (2026).
Related reading on this site: every UK LTAF on the FCA register and how UK fund structures work.
Further Reading
New Fund Structures for Alternatives: The LTAF and ELTIF
An introduction to the LTAF and ELTIF — two new fund structures designed to broaden access to alternative investments for a wider range of investors.
Read guideLTAFs Explained: The UK's Long-Term Asset Fund for Retail Investors
A complete guide to Long-Term Asset Funds (LTAFs) — structure, liquidity windows, FCA rules, and how UK retail investors access them via SIPPs and platforms.
Read guideDisclaimer: This article summarises published FCA research for professional and industry readers. It is not financial, legal or investment advice, and it is not a substitute for reading the source publication. Figures reflect AIFMD regulatory reporting as published on 3 September 2026 and may be revised.
Industry newsletter
The industry view, monthly.
Research and ecosystem updates for the firms building, distributing and supporting private-market investments.