

The Number Behind the Headlines
Private markets have been described as opening up to individual investors for most of a decade. On 3 September 2026 the FCA published the first market-wide dataset on UK alternative funds built from regulatory returns, and it puts a figure on how far that has actually gone.
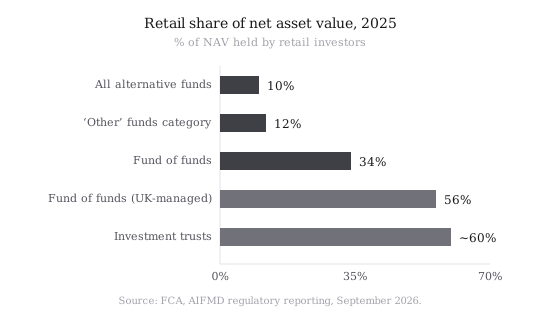
Retail investors hold 10% of the £5.1tn of net asset value in alternative funds marketed to UK investors. Institutions and non-institutional professional investors hold the other 90%. That split has been broadly stable over the past five years.
Ten per cent of a very large number is still substantial money. But the useful question is not the percentage but *which structures* that money sits in, because the answer determines what an individual investor can realistically buy, in what wrapper, and at what cost.
Where Retail Money Actually Sits
Retail capital is not spread evenly across the market. It clusters in two categories.
Fund of funds. Retail holds 34% of NAV market-wide, and 56% among funds managed by UK AIFMs. These are vehicles that buy other funds: one layer of diversification, and one extra layer of fees.
The "other" category. Retail holds 12% market-wide and 19% of UK-managed. This residual bucket is where most investment trusts sit.
Look at the strategies that dominate private-markets marketing, such as direct private equity, direct private credit and hedge funds, and retail ownership is thin. That is not an accident of distribution. Those funds have historically been built with minimums, eligibility rules and drawdown mechanics designed for institutional capital.
One further data point sets the scale of the newer retail-facing structures. Among UK-managed alternative funds, NURS funds are 18% by count, Qualified Investor Schemes 2%, and Long-Term Asset Funds 0.4%. The LTAF is the structure most often described as the retail gateway to private assets. By count, it is currently a rounding error.
The Investment Trust Is Still the Main Route
For a UK individual investor who wants exposure to private assets inside an ISA or SIPP, the listed investment trust remains the most practical route, and the data reflects that. Retail investors have held around 60% of investment trust NAV for a decade.
Around 280 investment trusts trade on the London Stock Exchange: roughly 225 general trusts, 44 VCTs and 11 REITs. They are closed-ended, so the manager never has to sell assets to fund your exit. You sell your shares to another buyer instead. That is what makes it possible to hold genuinely illiquid assets in a daily-tradeable wrapper.
Two caveats are worth holding onto.
First, most trusts hold no private assets at all. The average allocation to private assets is around 20%, but the median is zero. Buying "an investment trust" is not buying private-markets exposure; you have to check each vehicle's holdings. Around 15% of matched trust assets were unlisted equity and 5% structured credit or loans, concentrated in specialist vehicles.
Second, the price you pay is not the NAV. Across the 244 trusts the FCA matched to fund data, aggregate market capitalisation was about £165.2bn against £174.9bn of NAV, a discount of roughly 6% in aggregate, with much wider dispersion at individual trust level. Discounts can work for you on entry and against you on exit.
Fund of Funds: Access With a Fee Layer
The other place retail capital concentrates is fund of funds, where retail holds 56% of UK-managed NAV. The appeal is straightforward: one purchase gets you a spread of underlying managers, and the vehicle handles capital calls, manager selection and reporting.
The trade-off is equally straightforward. You pay fees at the fund-of-funds level and again at the underlying fund level. In an asset class where net returns are the entire argument for accepting illiquidity, a second fee layer needs justifying with something specific, such as access to managers you could not otherwise reach, or genuine selection skill.
It is also worth noting how concentrated this segment is. Among managers whose primary strategy is fund of funds, the top 25 firms hold 73% of NAV, and the largest five hold 38%. Retail-accessible fund of funds is a small field of very large houses.
Retail Money Is Growing, Slowly
The stable 10% share can make it look as if nothing is changing. In absolute terms it is. Retail NAV in UK-managed alternative funds rose from £159.4bn in 2016 to £366.9bn in 2025, more than doubling over a decade.
What has not changed is retail's *share*. Professional capital grew at a similar pace. The market has expanded 30% in five years to £5.1tn, with private credit fund count more than doubling and private equity NAV up 53%, but that growth has been funded mainly by institutions.
For an individual investor, the practical read is that the newer retail-facing structures (LTAFs, retail-eligible feeder funds, platform-distributed private-markets funds) are real but early. The infrastructure to hold them in an ISA is being built now rather than being finished. Our review of LTAFs inside a Stocks and Shares ISA covers what is actually available today, and which alternatives qualify for an ISA sets out the wrapper rules.
The Risks the Data Does and Does Not Show
The FCA found that leverage and liquidity risks in this market are concentrated rather than widespread. Aggregate leverage excluding hedge funds has sat at roughly 99–114% of NAV since 2016, close to no leverage at all. Hedge funds carry most of the reported leverage, with 2025 median ratios of 812% for macro strategies.
Two points from that analysis matter directly to individual investors.
Fund-level leverage is not the whole picture. The regulator's measure captures borrowing at the fund. Debt inside the underlying portfolio companies generally is not reflected. A private equity fund reporting no leverage may hold companies carrying substantial debt.
Liquidity mismatch shows up in property. Reported liquidity profiles do not suggest a market-wide shortfall under normal conditions, but some mismatch appears over shorter horizons, particularly in real estate funds. UK investors who lived through the 2016 and 2020 property-fund suspensions will recognise the pattern; it is a structural feature of holding buildings in a fund that promises frequent dealing. Real estate funds are under 8% of UK-managed funds and 3.5% of NAV, so the systemic reading is modest. The individual reading, if that is where your money is, is not.
Four Practical Checks
If you are considering a fund or trust for private-market exposure, the FCA's data suggests four questions worth answering before you buy.
1. What does it actually hold? Median private-asset exposure across investment trusts is zero. Read the latest factsheet and portfolio breakdown rather than the vehicle's category label.
2. How many fee layers am I paying? Fund of funds means two. Check the ongoing charges figure and whether performance fees apply at both levels.
3. What is the exit mechanism, honestly stated? Listed trusts: sell to another buyer, at whatever discount prevails. LTAFs: monthly dealing at best, with a minimum 90-day notice period. Open-ended property: dealing that can be suspended.
4. Am I inside the regulatory perimeter? Authorised funds and listed trusts come with FCA oversight and, depending on the failure, potential FSCS and Financial Ombudsman Service recourse. Many direct alternative-asset offers marketed to individuals do not. Our platform directory records regulatory status on each profile.
Firms and advisers looking at the same report from the industry side may find our companion piece useful: Inside the UK Alternative Fund Market.
Further Reading
New Fund Structures for Alternatives: The LTAF and ELTIF
An introduction to the LTAF and ELTIF — two new fund structures designed to broaden access to alternative investments for a wider range of investors.
Read guideLTAFs Explained: The UK's Long-Term Asset Fund for Retail Investors
A complete guide to Long-Term Asset Funds (LTAFs) — structure, liquidity windows, FCA rules, and how UK retail investors access them via SIPPs and platforms.
Read guideDisclaimer: This article is for information only and does not constitute financial advice. All market figures are drawn from FCA research published on 3 September 2026 based on AIFMD regulatory reporting. Capital is at risk. Investment trust share prices can trade at a discount or premium to net asset value. Tax treatment depends on individual circumstances and may change.
Weekly newsletter
The UK alternative investment market, weekly.
New listings, FCA status changes, and market moves — every week.